

Rename factors in ggplot2 with Labeller() function in R
Display custom labels for variables during visualization

How do you normally rename factor variables when you plot?
The tidyverse has a function called `labeller`, which is used to conveniently relabel facet (or strip) labels.
It can also be easily modified to create a labeling function for any factor variable.
Step 1
Set up a plot to modify:
iris %>% filter(Sepal.Width == 3.1) %>%
  ggplot() +
  geom_boxplot(aes(x=Species, y=Sepal.Length)) +
  theme_minimal()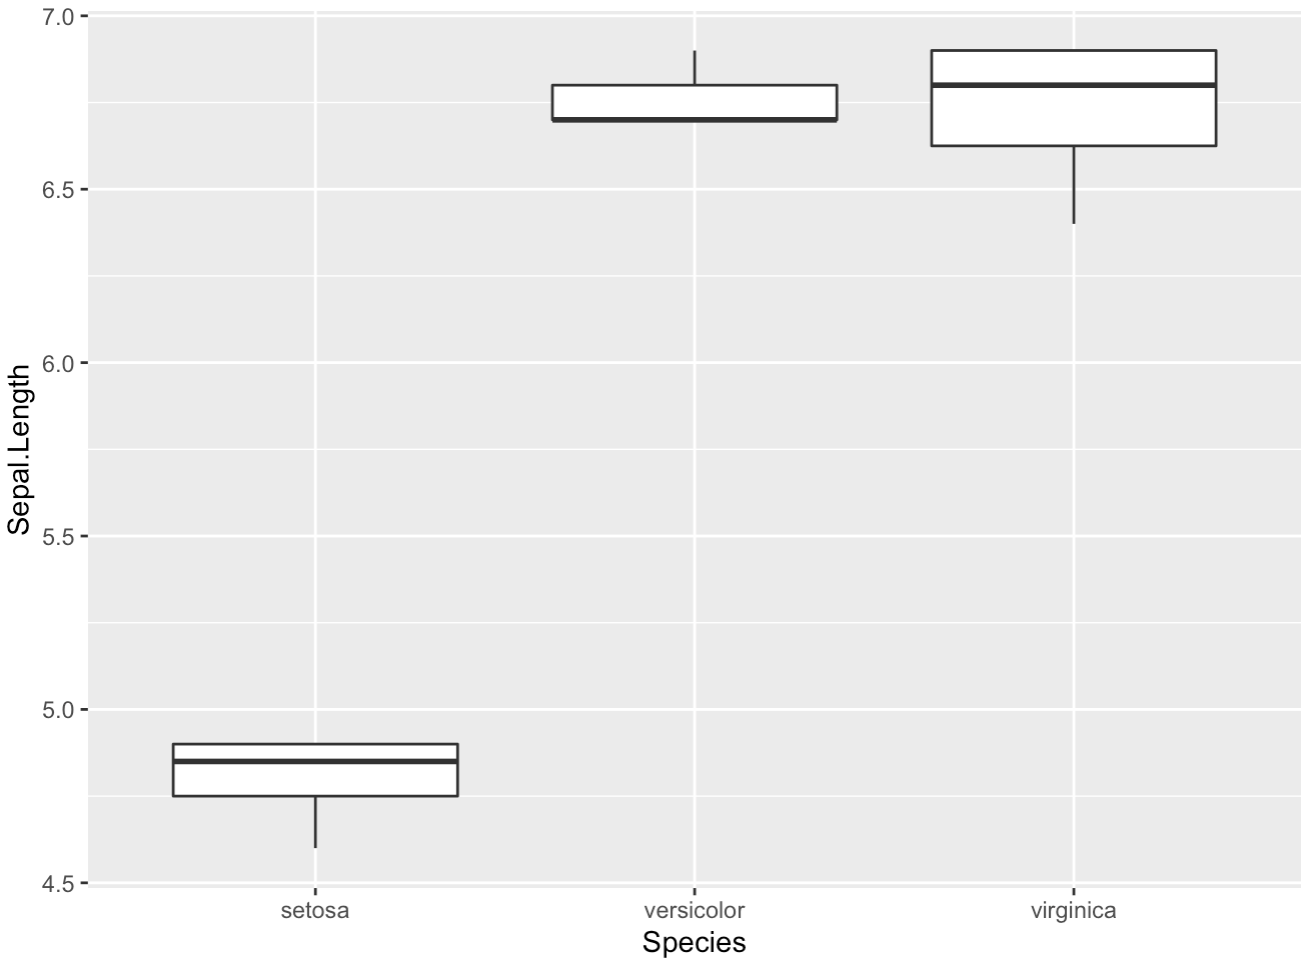
Step 2
create a labeller function to define new labels for each factor.
relabel.Species = as_labeller(c(setosa = "Poppy",
                   versicolor = "Rose",
                   virginica = "Daisy"))
the ‘as_labeller’ function packages the named list as a lookup function. You can test this by running `relabel.Species(“versicolor”)` which will return a new label.
Step 3
create a new label column when the plot is created
iris %>% as_tibble() %>% filter(Sepal.Width == 3.1) %>%
  rowwise() %>%
  mutate(Species2 = factor(relabel.Species(Species))) %>%
  ggplot() +
  geom_boxplot(aes(x=Species2, y=Sepal.Length)) +
  theme_gray()
The rowwise() function forces R to mutate each row separately, rather than all the rows. The new relabel.Species function converts the Species variable to a new name and then is converted back into a factor.
ggplot (or any R verb after the operation) will be none the wiser! Alternatively, you could create a new column (Species.Label) instead of replacing the old column.